Testing Tour #5: Exploring the observability world with Abby Bangser!
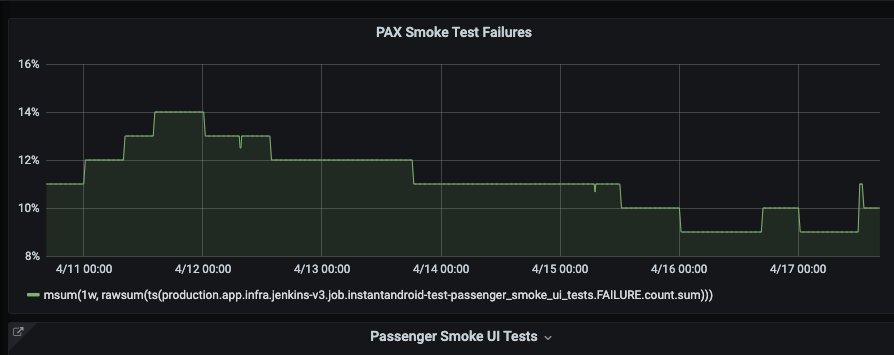
Abby was such a pleasure to work with! We originally planned to discuss about observability but when we started our session, as I was already familiar with the tools (as we use it at work), Abby quickly shifted gears and asked how she could help me. The challenge I was facing then was to extract the test failure count from jenkins test results and project it on a dashboard in Grafana. Being new to Grafana and wavefront query language, I shared my objective with Abby. I learnt that the Wavefront Query Language lets you retrieve and display the data that has been ingested into Wavefront. Time series data The query language is particularly well suited to time series data, because it accommodates the periodicity, potential irregularity, and streaming nature of that data type. Histograms The query language includes functions for manipulating histograms. Traces and spans Use the tracing UI to query traces and spans. So, what is a q...