Testing Tour #5: Exploring the observability world with Abby Bangser!
Abby was such a pleasure to work with! We originally planned to discuss about observability but when we started our session,
as I was already familiar with the tools (as we use it at work), Abby quickly shifted gears and asked how she could help me.
The challenge I was facing then was to extract the test failure count from jenkins test results and project it on a dashboard
in Grafana.
Being new to Grafana and wavefront query language, I shared my objective with Abby. I learnt that the Wavefront Query Language
lets you retrieve and display the data that has been ingested into Wavefront.
Time series data The query language is particularly well suited to time series data, because it accommodates the
periodicity, potential irregularity, and streaming nature of that data type.
Histograms The query language includes functions for manipulating histograms.
Traces and spans Use the tracing UI to query traces and spans.
So, what is a query?
In order to understand that, we examined time series data: A time series measures a particular phenomenon over time.
Each query has the following components. Only the metric is required, the other elements are optional
but help you get the information you’re really interested in.
A metric (or a constant such as 10).
If we wanted to find the average number of tests run, then the metric is ~smoketests.10m
One or more sources. Above, sources are tests. Here, sources could be the host, VM, container, etc. In this example,
app-* – that means metrics that come from db-* are ignored.
One or more point tags. In this example,
we have the env point tag with value production. Only valid point tags
can be queried.
One or more functions. This example uses the avg() function, and the mmedian() function with a 10 minute time window.
The Query Language Reference lists each function with a short description and points to reference pages.
So the query goes as follows:
mmedian(10m, avg(ts(“~smoketests.10m” AND source=”app-*” AND env=”production”)))
All I had to do was kick off test runs a few times on jenkins, to help compile test data and then using wavefront query language,
I was able to print out the graph on grafana:
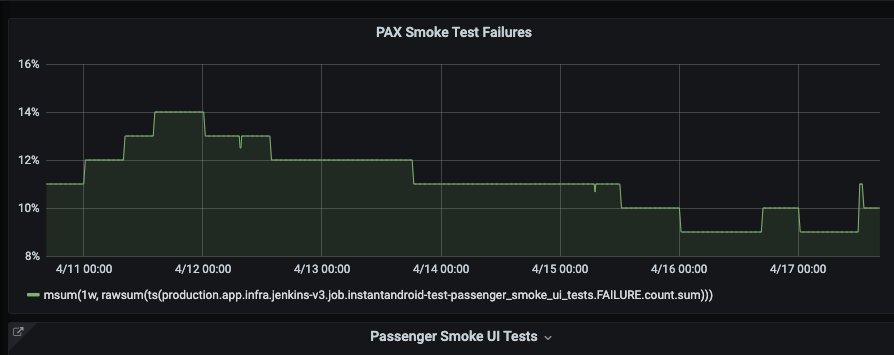
In this case, I was trying to depict the failure rate. Hence my query was:
msum(1w, rawsum(ts(production.app.infra.jenkins-v3.job.<jenkins job info>.FAILURE.count.sum)))
Msum is the sum function, followed by rawsum - which is another function to literally count all the failures within the jenkins jobs
that were run in the past week - which is depicted by 1w.
A raw sum is computed only from real values reported at a given moment in time. No interpolation is performed to fill in data gaps
in any time series. Use sum() if you want the sums to include interpolated values wherever possible. Using rawsum()
instead of sum() can significantly improve query performance.
We also explored how wavefront has a way to depict graphs and here’s how it looks:
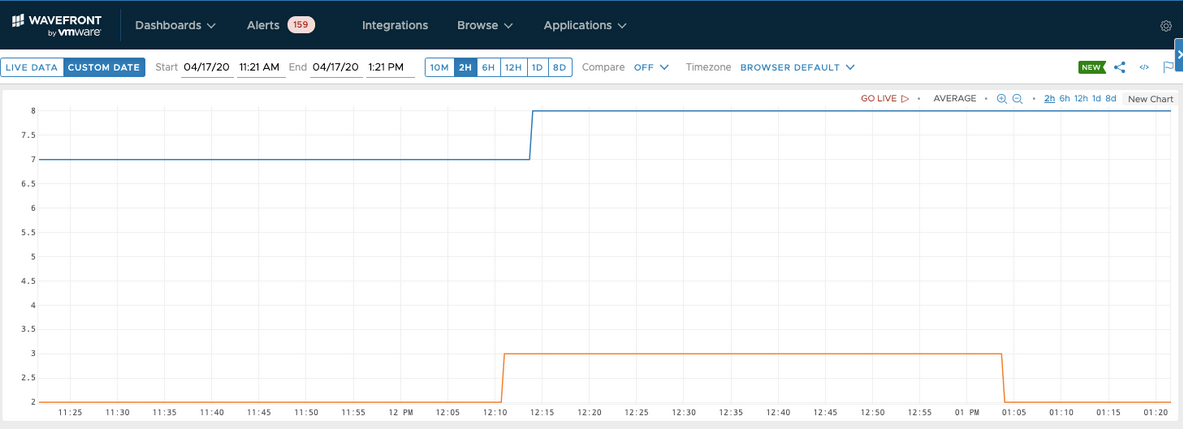
I felt grafana dashboard was better since I found it difficult to interpret the values against the metrics projected.
The commonly used functions in WQL are:
Aggregation function
Filtering and comparison functions
Join function, etc.
These functions came in handy when I was trying to create more dashboards with different capabilities. Overall it was a fun session
with Abby and I learnt so much about wavefront query language!
Hugs Abby! :)
Comments
Post a Comment